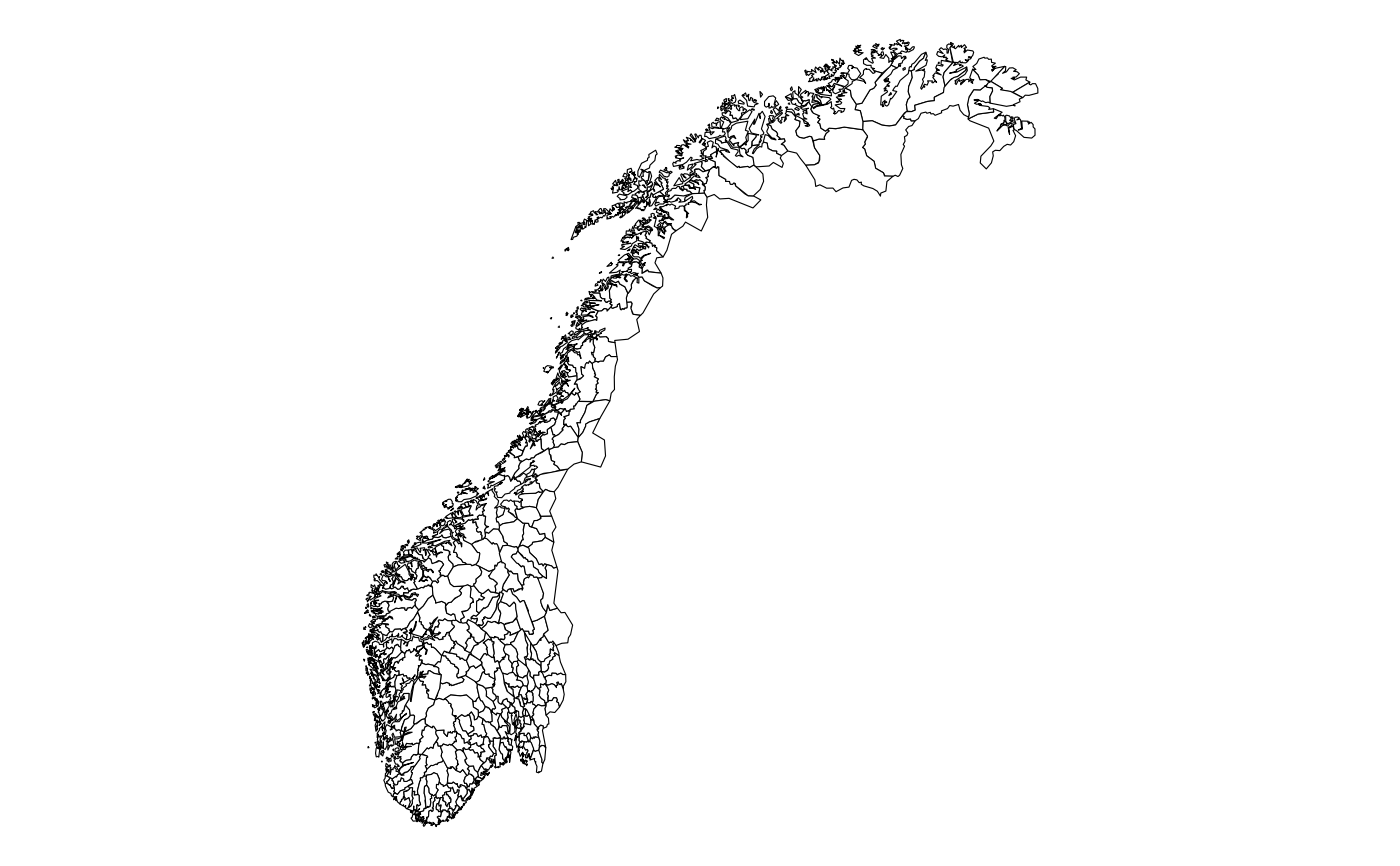
Maps of Norwegian municipalities in sf format
Source:R/data_norway_municip.R
nor_municip_map_bxxxx_default_sf.RdWe package the map datasets for Norwegian municipalities, taken from
Geonorge, as simple features objects. They suit the sf package and
ggplot2::geom_sf().
This data is licensed under Creative Commons BY 4.0 (CC BY 4.0).
Usage
nor_municip_map_b2024_default_sf

nor_municip_map_b2020_default_sf

nor_municip_map_b2019_default_sf
Format
Each dataset is an sf data frame with one row per municipality:
- geometry
MULTIPOLYGON geometry column. Geographic coordinates on WGS84 (
"+proj=longlat +datum=WGS84 +no_defs"), which sf treats as equal to EPSG:4326. The objects carry no EPSG authority code, sosf::st_crs(x)$epsgisNA.- location_code
Municipality code (e.g.
"municip_nor0301").
An object of class sf (inherits from data.frame) with 356 rows and 2 columns.
An object of class sf (inherits from data.frame) with 422 rows and 2 columns.
Source
Kartverket / Geonorge https://www.geonorge.no/. License: CC BY 4.0.
Details
Borders for 2024, 2020, and 2019 are provided, in the default layout only,
holding 356, 356 and 422 municipalities respectively. The 2024 datasets carry
the same Haram gap as the data.table versions; see
nor_municip_map_bxxxx_default_dt.
See also
vignette("sf_interactive", package = "csmaps") shows the sf-plus-
leaflet workflow, but on the county sf dataset. No vignette uses a
municipality sf dataset.
Other municipality maps:
nor_municip_map_bxxxx_default_dt,
nor_municip_map_bxxxx_insert_oslo_dt,
nor_municip_map_bxxxx_split_dt
Other sf maps:
nor_county_map_bxxxx_default_sf,
oslo_ward_map_bxxxx_default_sf
Examples
library(ggplot2)
q <- ggplot(csmaps::nor_municip_map_b2024_default_sf)
q <- q + geom_sf(fill = "white", color = "black", linewidth = 0.2)
q <- q + theme_void()
q