Maps of Norwegian counties in sf format
Source:R/data_norway_county.R
nor_county_map_bxxxx_default_sf.RdWe package the map datasets for Norwegian counties, taken from Geonorge, as
simple features objects. They suit the sf package and
ggplot2::geom_sf().
This data is licensed under Creative Commons BY 4.0 (CC BY 4.0).
Usage
nor_county_map_b2024_default_sf

nor_county_map_b2020_default_sf

nor_county_map_b2019_default_sf

nor_county_map_b2017_default_sf
Format
Each dataset is an sf data frame with one row per county:
- geometry
MULTIPOLYGON geometry column. Geographic coordinates on WGS84 (
"+proj=longlat +datum=WGS84 +no_defs"), which sf treats as equal to EPSG:4326. The objects carry no EPSG authority code, sosf::st_crs(x)$epsgisNA.- location_code
County code (e.g.
"county_nor03").
An object of class sf (inherits from data.frame) with 11 rows and 2 columns.
An object of class sf (inherits from data.frame) with 18 rows and 2 columns.
An object of class sf (inherits from data.frame) with 19 rows and 2 columns.
Source
Kartverket / Geonorge https://www.geonorge.no/. License: CC BY 4.0.
Details
Borders for 2024, 2020, 2019, and 2017 are provided, in the default layout only. The number of counties differs by border year: 15 in 2024, 11 in 2020, 18 in 2019, and 19 in 2017.
See also
vignette("sf_interactive", package = "csmaps") passes
nor_county_map_b2024_default_sf to leaflet. No vignette uses the
2020, 2019 or 2017 sf datasets.
Other county maps:
nor_county_map_bxxxx_default_dt,
nor_county_map_bxxxx_insert_oslo_dt,
nor_county_map_bxxxx_split_dt
Other sf maps:
nor_municip_map_bxxxx_default_sf,
oslo_ward_map_bxxxx_default_sf
Examples
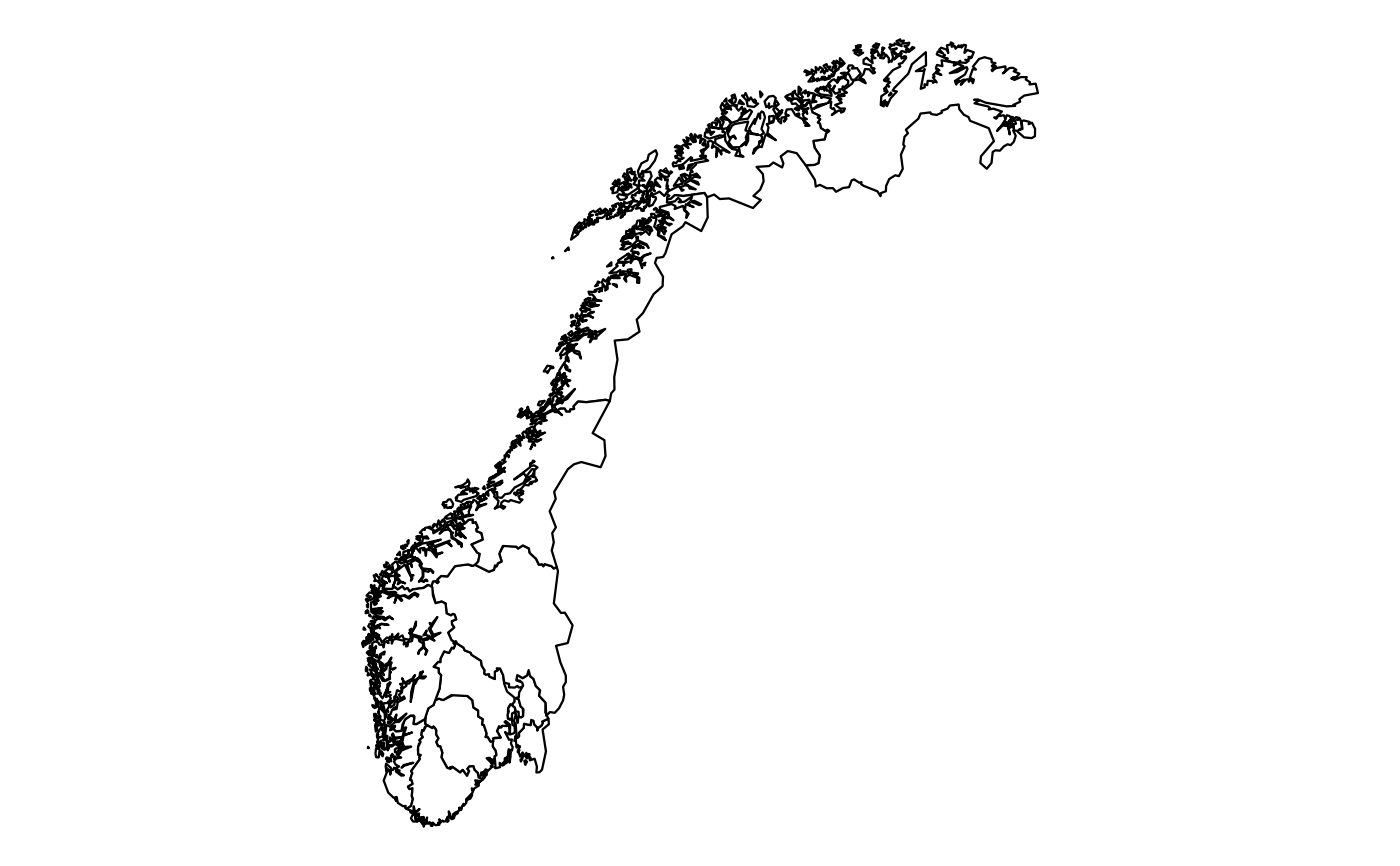
library(ggplot2)
q <- ggplot(csmaps::nor_county_map_b2024_default_sf)
q <- q + geom_sf(fill = "white", color = "black", linewidth = 0.4)
q <- q + theme_void()
q